How Astronomers Use a Rare Gravitationally Lensed Supernova to Measure the Universe's Expansion Rate
Introduction
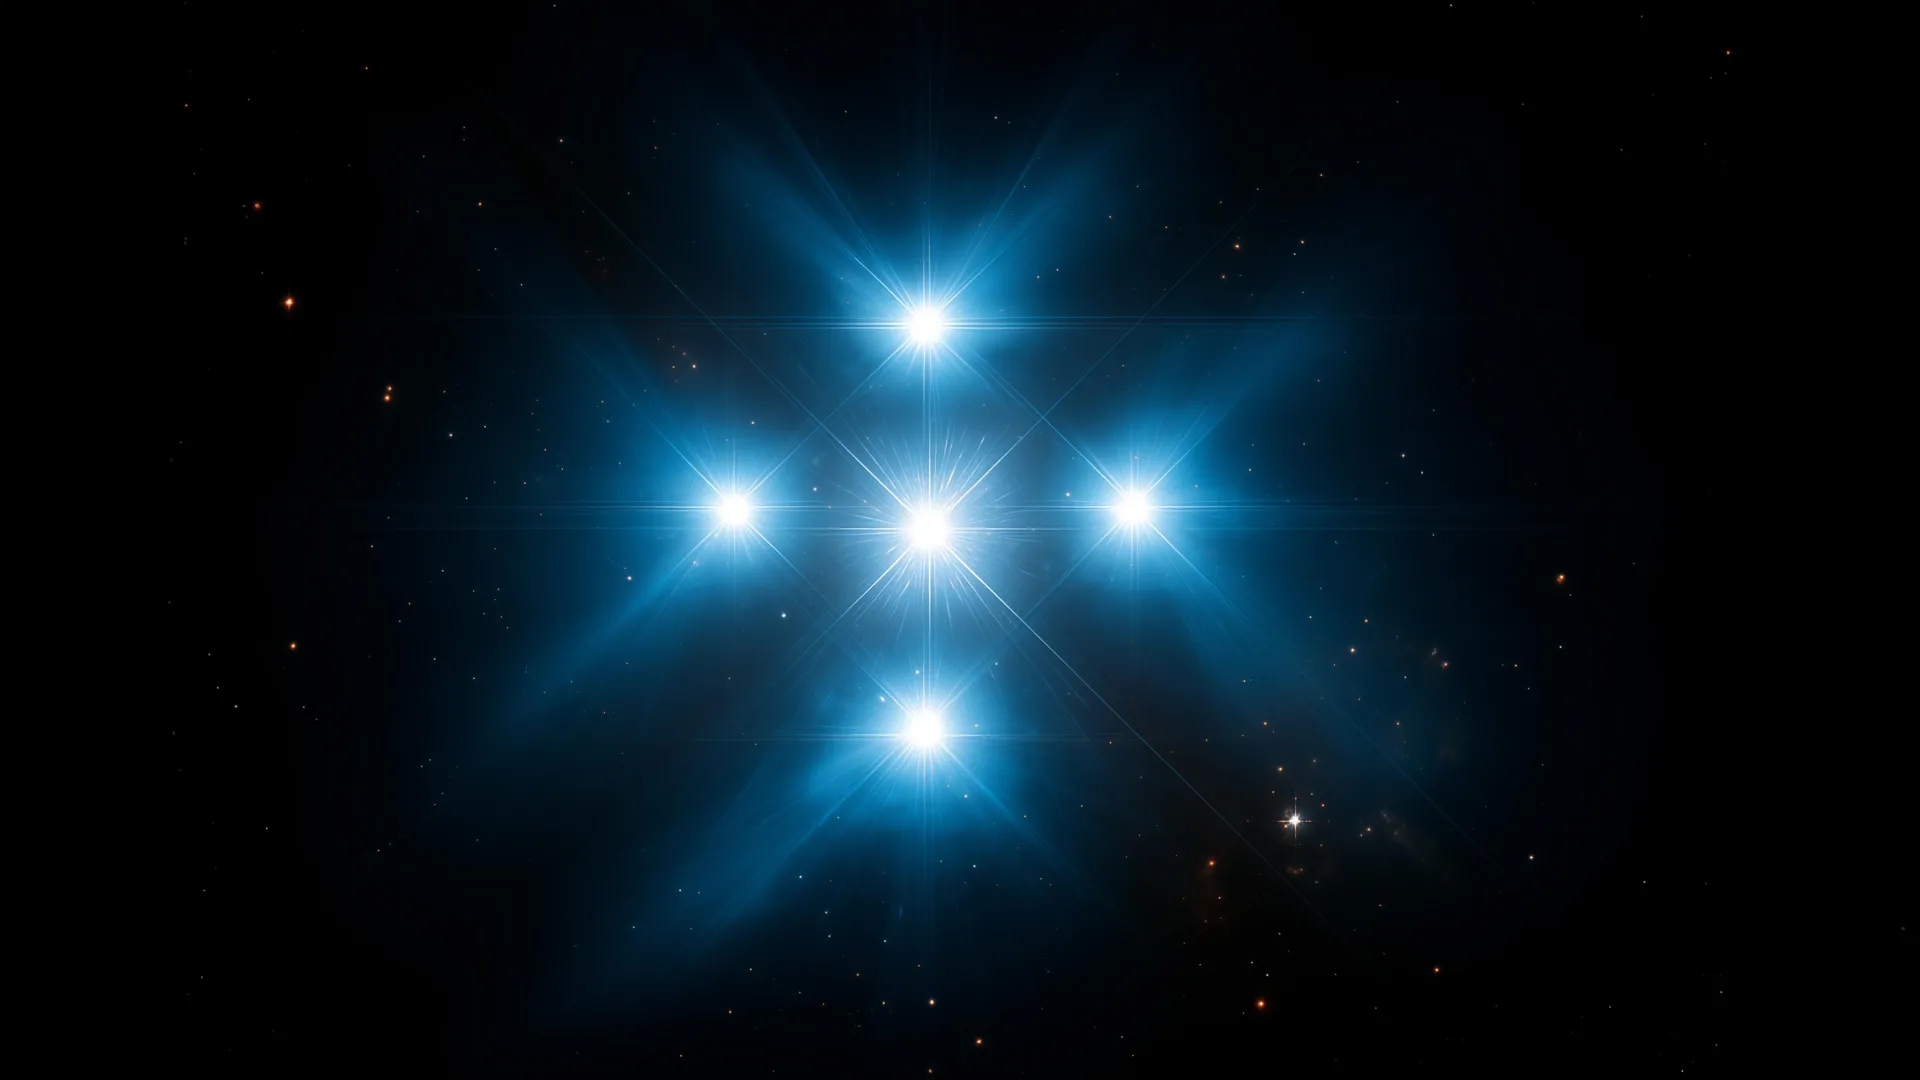
Imagine a single cosmic explosion—a supernova—appearing five times in the same patch of sky, like a celestial mirage. That’s exactly what astronomers have observed with a spectacular event nicknamed “SN Winny”. Located a staggering 10 billion light-years away, this superluminous supernova is being gravitationally lensed by two foreground galaxies, creating multiple images. The real magic? By measuring the tiny time delays between when each image appears, scientists can directly calculate the expansion rate of the universe—a constant known as the Hubble parameter. This guide walks you through the step-by-step process astronomers use to turn a rare cosmic coincidence into a precision measurement. Whether you’re an amateur astronomer or just curious, follow along to see how the universe’s clock is being read.
What You Need
- A powerful telescope – Typically ground-based 8–10 meter class telescopes (e.g., Keck, Subaru) or space telescopes like the Hubble Space Telescope to capture faint, distant objects.
- High-resolution imaging and spectroscopy instruments – To resolve multiple lensed images and obtain spectra for confirmation.
- Sky survey data – Wide-field surveys (e.g., Pan-STARRS, ZTF, LSST) provide time-series alerts for supernova candidates.
- Gravitational lens modeling software – Programs like GRAVLENS, LENSTOOL, or similar to fit the lens mass distribution and predict time delays.
- Light curve analysis tools – To extract precise timing of each supernova image peak (e.g., using pyLightcurve or custom scripts).
- Cosmological background knowledge – Understanding of Friedmann equations, dark energy, and the Hubble constant (H₀) debate.
- Patience and luck – Gravitationally lensed supernovae are exquisitely rare; SN Winny is a one-in-a-million discovery.
Step 1: Identify a Candidate Gravitationally Lensed Supernova
Astronomers begin by scanning large-area sky surveys for transient events—brief brightenings that could be supernovae. The Pan-STARRS or Zwicky Transient Facility (ZTF) alert streams are combed for anomalies. For SN Winny, the critical clue was multiple bright spots near a massive foreground galaxy cluster. The initial detection is often automated, but humans (or machine learning) flag candidates that appear in a configuration typical of strong gravitational lensing: arcs, Einstein rings, or multiple point sources arranged around a lens galaxy.
Tip: Look for events that show multiple peaks in brightness with similar colors, suggesting they are the same explosion seen from different angles.
Step 2: Confirm Gravitational Lensing via Spectroscopy and Imaging
Once a candidate is identified, follow-up observations are critical. High-resolution imaging reveals whether the separate images are indeed from the same distant source. For SN Winny, Hubble Space Telescope images showed five distinct points of light, but confirmation required spectroscopy. Spectra from each image must show identical spectral lines (same redshift, same composition) and a nearly identical supernova type—Type I superluminous supernova in this case. Any slight differences in brightness or line profiles must fit a lensing model, not intrinsic variation.
Astronomers also check for the presence of a foreground lens galaxy at the appropriate redshift (around z=0.5 for SN Winny’s case). This step eliminates alternatives like random alignments of unrelated supernovae.
Step 3: Monitor the Light Curves of Each Image Continuously
This is the most demanding step. Each lensed image of the supernova will brighten and fade at slightly different times due to the different path lengths light travels around the lensing galaxies. For SN Winny, the delays range from minutes to years (in this case, about a few months). Astronomers must observe all five images regularly—every few days—using telescopes spread across the globe to ensure around-the-clock coverage. The goal is to capture the peak brightness and the full light curve shape for each image.
Data is often combined from multiple observatories, and careful calibration is needed to account for Earth’s atmosphere and telescope differences. Advanced software fits a template supernova light curve (say, a standard Type Ia or superluminous model) to each image to determine the exact time of maximum.
Step 4: Measure the Time Delays Between Appearances
With precise light curves in hand, the next step is to compute the time offset between each image’s peak. For example, if image A peaks on January 1 and image B on March 15, the delay is 73 days. SN Winny’s images span delays of up to several months. This is done by cross-correlating the light curves or fitting a warping function. The accuracy of these delays is paramount—errors of even a few hours can affect the final calculation of the expansion rate.
The time delays between different images, along with the geometry of the lens system, encode the Hubble constant. The longer the delay, the more sensitive the measurement becomes to the expansion rate.
Step 5: Model the Gravitational Lens and Compute the Hubble Constant
Now comes the heavy theoretical lifting. Astronomers use lens modeling software to reconstruct the mass distribution of the foreground lens galaxies—both the visible stars and the invisible dark matter halo. The model must reproduce the observed positions, shape, and brightness of all five images. Crucially, the model predicts the time delays the light should experience based on the distance scale and the expansion rate.
By comparing the predicted delays with the measured delays, scientists solve for the Hubble constant. The relationship is:
Time delay ∝ 1 / H₀
So a longer measured delay implies a slower expansion. For SN Winny, the unique five-image configuration provides multiple constraints, reducing systematic errors. The result is a direct geometry-based measurement of the universe’s expansion rate, independent of the cosmic distance ladder.
Step 6: Cross-Check with Independent Methods and Refine
No result is final without verification. Astronomers compare the H₀ value derived from SN Winny with other methods: (a) the standard candle approach using Type Ia supernovae, (b) the cosmic microwave background (Planck satellite), and (c) other time-delay lensed quasars. Discrepancies—like the current Hubble tension—can reveal new physics or hidden biases. For SN Winny, the team is also checking for microlensing effects from stars in the lens galaxy that can subtly shift the image positions and timing.
Future monitoring of this system over several years may yield even better constraints. Any systematic uncertainties in the lens model (e.g., the mass profile slope) are propagated through Monte Carlo simulations to give a final error bar.
Tips for Understanding and Following This Research
- Stay updated with publications: Follow journals like Nature Astronomy or Astrophysical Journal for papers on SN Winny (official designation likely SN2023xxx).
- Watch for future discoveries: The Rubin Observatory LSST will find hundreds of lensed supernovae, making this technique routine.
- Learn the basics of gravitational lensing: Interactive simulations (e.g., Einstein’s lens at websites like cosmic-ripples.org) help visualize how light bends.
- Understand the Hubble tension: The discrepancy between early-universe (CMB) and late-universe (supernovae) measurements makes studies like SN Winny critical.
- Check for public data releases: Some surveys share light curves; you can try to replicate the analysis with free tools like gnuplot or Python.
- Talk to a professional astronomer: Many are active on social media (e.g., X/Twitter) and may answer questions about the process.
With SN Winny, the universe has provided a rare laboratory. By carefully following these six steps, astronomers are turning a one-in-a-million supernova into a precision ruler for cosmic expansion. And that’s how a handful of photons from 10 billion years ago can reveal the fate of our universe.
Related Articles
- Quantum Leap: Photon State Teleported Across 270 Meters Between Independent Quantum Dots
- Decoding AI Reasoning: The Role of Test-Time Compute
- How to Build a Video World Model with Extended Long-Term Memory Using State-Space Models
- Voyager 1 Powers Down 50-Year-Old Instrument to Conserve Energy in Deep Space
- How Young Gut Bacteria Reversed Liver Aging in Mice: Key Q&A
- How NASA's Psyche Mission Captured Mars During Its Gravity Assist: A Step-by-Step Technical Breakdown
- How to Choose a 3‑Row SUV That Actually Works for Families (And Why the VW Atlas Nails It)
- Bohmian Mechanics Challenge Quantum Orthodoxy: A Testable Path to Objective Reality?